Showing posts with label Rent Tracker. Show all posts

Wednesday, November 15, 2017

Uncertain futures - Renters in the Census 2016

The second round of the 2016 Census was released last week, and amongst employment, education and travel statistics there's the question of whether respondents had moved in the previous few years.


We took a look at this question across different tenure types. It probably comes as no surprise that renters in the private sector were nearly 3 times more likely to have moved in the last year as any other tenure type. In fact, more than a third of renters in New South Wales moved home in the last year.

In the last 5 years, more than three quarters of renting households had changed. This is entirely consistent with findings included in our latest Rent Tracker about the churn of rental bonds in NSW.


The story continues for people aged 60 years and over:

People who may particularly need to remain in a single home are, because they are in the private rental sector, three times as likely to have moved in just the previous year as any other tenure type. There were about 136,000 tenants aged 60 or over at the Census, meaning 23,000 had moved in the last year, and a further 44,000 in the last five.

This level of insecurity is unsustainable. Previously, people who were unable to purchase their own home in order to have housing stability and affordability in retirement would be able to rely on social housing. As above, movement in social housing is fairly comparable to owner occupiers, but years of under investment has meant it is reaching historically low levels.

As people are increasingly renting into retirement, change is needed to ensure private renting is stable, livable and affordable - primarily, the removal of unfair evictions.

Thursday, July 13, 2017

Economically viable supply

Speaking at a Sydney Alliance assembly on housing affordability last night, the NSW Minister for Planning and Housing, the Hon. Anthony Roberts MP, dismissed targets for affordable housing in new residential developments as a simplistic and unrealistic housing solution. "In reality all these targets do is reduce the supply of affordable rental housing because it makes many developments economically unviable." Instead, he talked up the Government's intention to solve Sydney's housing affordability crisis by rezoning large swathes of the city and fast-tracking new supply.

Inclusionary zoning is like a box of chocolates...?
This is a curious position for a Housing Minister in the Berejiklian "housing-affordability-matters" Government to take, given the overwhelming evidence suggests a single-minded focus on new supply is a simplistic and unrealistic housing solution.

Since the beginning of 2017 - dubbed "the year of the renter" by Domain as there will soon be more renters than homeowners in Sydney - we've discussed the issue of housing affordability and supply many times on the Brown Couch.

In late January we released a Rent Tracker report, which highlighted how rents have gone up even in suburbs where large numbers of properties are being added to the rental market. In February we discussed how Sydney's new housing development is producing the wrong kind of supply, driven by the demands of investors rather than householders and home makers. In April we noted the findings of Anglicare's seventh Rental Affordability Snapshot, showing that rental affordability is as bad as it has ever been and still gets worse every year.

In May the latest Rental Affordability Index was released, confirming what Rent Tracker and the Rental Affordability Snapshot had already suggested about deteriorating rental affordability despite increasing residential development activity. We dug in a little to look at exactly what's going on, exploring how the wrong kind of supply has changed the shape of the rental market. It produces higher rents rather than improving rental affordability.

In June we joined the dots on housing affordability, looking at how the NSW Government's housing affordability package is likely to impact upon the market for supply. We suggested it might be combined with both the NSW Opposition's housing affordability package, which includes targets for affordable housing, and some of the Australian Government's Federal Budget measures, which includes a method for funding new affordable housing, to help keep residential property developers afloat while ensuring at least some new supply is delivered into the affordable rental housing sector.

Also in June we discussed the release of data from the 2016 Census, which shows that the renting population is still growing faster than the population generally, and the stress of high housing costs affects renters far more than it does homeowners.

Something we haven't yet discussed is the Australian Housing and Urban Research Institute's recent report into "Housing supply responsiveness in Australia". This report found that most of the growth in Australia's housing supply has been taking place in the mid-to-high price segments, rather than low price segments, and suggests "there seems to be structural impediments to the trickle-down of new housing supply". It also says that "targeted government intervention might be needed in order to ensure an adequate supply of affordable housing." The report hasn't received a lot of attention other than a quick report in the Guardian when it was released earlier this year. It could do with some more, so we'll take a closer look at it when we can.

In the meantime, let's get back to the Minister's words from last night. "In reality all these targets do is reduce the supply of affordable rental housing because it makes many developments economically unviable."

On the other hand, current developments are causing rental affordability to deteriorate again, and again, and again. So at what point do we stop and wonder - if we still can't afford to live in them, what is the value of an economically viable development after all?

The answer to that question might make more sense to someone who values housing as nothing more than a financial asset, rather than a place to call home.

Wednesday, May 17, 2017

Rental affordability deteriorates, again

Hot on the heels of the Anglicare Rental Affordability Snapshot for 2017, the SGS Economics and Planning, Community Sector Banking and National Shelter Rental Affordability Index for December 2016 reveals what most Sydney-siders and New South Welsh-folk already know: the squeeze on rents is getting tighter.

Picture by thepurpah
The headline finding is that Sydney's rental affordability is as bad as ever, having plunged to a record low towards the end of last year. The average household now pays around 29% of their income on rent - meaning that renters with even reasonable wages are heading towards a form of housing stress, if they're not already there.

Unsurprisingly, the least affordable suburbs are harbour-side. They include Elizabeth Bay, Rushcutters Bay, Potts Point, Woolloomooloo, Double Bay, Milsons Point, Kirribilli, Darling Point, Point Piper, Edgecliff and Woollahra. For a dual income household with kids, bringing in $140,000 a year, a three bedroom home in any of these iconic suburbs would be unaffordable (30%-38% of income) or severely unaffordable (38%-60% of income), according to the index. For a single working parent earning around $70,000 per year, a 2 bedroom home in most of these suburbs would come in at the unaffordable range. Rent for an unemployed person looking for a single bedroom unit would be extremely unaffordable (60% or more of income) in all of these suburbs.

There's still some hope for working families. The dual income couple with kids might find a three bedroom home with an acceptable rent (20%-25% of income) around places like Hornsby, Epping, Lidcombe, Lakemba, Earlwood, Kogarah or Miranda. A single working parent might pay an acceptable rent for a two-bedder around Liverpool or Penrith.

But there's no such hope for the single unemployed person. Rents for one bedroom homes remain in the extremely unaffordable range for this cohort, throughout the entire Greater Sydney area. Even if three or four unemployed folk decided to pool resources and go in together for a sharehouse, rents for suitable properties remain extremely unaffordable until about Blacktown, Liverpool or Engadine. Further out they become severely unaffordable, but that's as far is it goes across the remaining suburbs.

Things improve for dual income households with kids once you get past the limits of Sydney, with the rest of New South Wales showing rents for three bedroom homes as generally acceptable, affordable (20%-25% of income), or very affordable (less than 20% of income). Of course, that's based on an annual household income of $140,000, which might be harder to come by in some of the further flung parts of the state, so take that with a grain of salt.

Single working parents will also do better outside of Sydney, subject to the same caveat: two bedroom homes for a household with an income of $70,000 per year will be acceptable, affordable or very affordable in most parts of New South Wales. Wollongong, central Newcastle and Byron Bay are the exceptions.

Where available, single bedroom homes remain severely unaffordable or extremely unaffordable to an unemployed person receiving an income support payment, right across the state. For those prepared to share, a two bedroom place might be moderately unaffordable for anyone on an unemployment benefit (25%-30% of income) around Wellington, Parkes or Cobar. If you can find a third person, rent for a three bedroom home might be acceptable in Cobar. Of course, your income payments might take a bit of a hit if you leave Sydney for one of these towns, as your chances of finding paid work will be somewhat diminished. You'll probably have your payments cut for up to 26 weeks after moving to an area with lower work prospects so don't forget to factor that in...

Why is this happening?
Conventional wisdom is that prices go up when supply doesn't keep up with demand, but there are a number of indicators telling us things are a little more complicated when it comes to rents. For a start, contemporary discussion around housing affordability tends to focus on the supply and demand of housing as a financial asset, rather than for its purpose of providing shelter. "Housing demand" has become something of a proxy for "mortgage demand", and "housing supply" is geared towards meeting the needs of mortgagors rather than home-makers - even if at the micro level these are often the same thing.

A quick look at where the current demand for residential property finance is coming from reveals a whole lot of it is going to investors.

Aust. property lending monthly ('000), investment (red) v owner occupation (blue), Jun 2001 - Feb 2017. Source: ABS
Evidently there's been more money pulled into the rental market than for owner-occupation over the last little while. In other words, the rental market is currently enjoying the lion's share of supply. But we can't assume this puts us on a path to affordability because the vast majority of supply into the rental market is coming from investors purchasing established dwellings rather than new builds.

NSW property investment lending monthly ('000), June 2001 - Feb 2017, established (red) v new (blue) dwellings. Source: ABS
Much of the increase in rental market supply comes at the expense of supply for owner-occupiers. Potential first home-buyers are particularly impacted by this, and they're remaining in the rental market for longer. Increasing rental market supply is absorbed by a more-or-less corresponding increase in demand for rental housing. But as we can see from the blue line above, investors have been putting larger amounts of mortgage finance towards new construction over the last little while. New construction delivers supply to meet "mortgage demand" - not just the demand for shelter - which should be putting downward pressure on rents. But, as the index shows, it's not.

Our latest Rent Tracker report shows this as well, indicating that rents have gone up in Sydney even where large amounts of new supply has been brought into the rental market. Based on the number of new rental bonds lodged, Rent Tracker doesn't distinguish between new rental supply coming from construction compared to that which comes from increased investment in established dwellings. But checking this against data from the NSW Department of Planning & Environment we can see that a great many new dwelling completions across Sydney are in the form of new apartments. These are most likely being purchased by investors.

New dwelling completions, Sydney. Source: NSW Dept L&E
With a high proportion of one and two bedroom units turning up for rent over the last few months, despite families with children making up the highest chunk of demand for rental housing, it's evident that this kind of investment is not being driven by what households really need. Rental supply is not being driven by renter demand, because housing supply is being driven by mortgage demand.

That's the story with new construction, but it's also the story with increased rental market supply in general. Investors aren't pulling established dwellings away from owner-occupiers because they want to provide housing for people who can't afford to buy, but because they hope to grow their wealth. The allure of wealth, after all, is what is driving demand for mortgages. Aided by tax settings that expedite the debt-to-wealth strategy - negative gearing and capital gains tax discounts - investors are encouraged to buy property based on prospects for profit rather than any measured demand from renter households. They're buying more expensive property as higher price tags come with faster and bigger gains. They're leaving the cheap stuff to developers who can turn it into more expensive property in order to meet investor demand...

Over time, this has changed the shape of the rental market. Affordable rents are a thing of the past.

Volume and rents ($/2011) of Australian rental properties over time. Source: AHURI
For that matter, we don't measure demand for rental housing like we used to. Back in the olden days the National Housing Supply Council - now defunct - used to report on the affordability and availability of rental housing. Then, as now, there was a shortage of properties available for rent to households on the very lowest incomes, for much the same reasons that we can see today. But it's easy to imagine that if this work had continued with appropriate levels of government support, we'd have a much clearer understanding of our rental affordability challenges and how to tackle them once and for all. Instead we've allowed things to get much worse.

Last week's Federal Budget has pinned a lot of hope on measures to increase supply. This includes the renewal of the National Affordable Housing Agreement, to be renamed the National Housing and Homelessness Agreement (NHHA). Under the NHHA the Australian Government will work with the states and territories to increase the supply of (mortgage driven) private rental housing through measures such as planning and zoning reforms. With the latest Rental Affordability Index in mind, we'll take a closer look at these Budget measures in a later post. In the meantime, parties to a new National Housing and Homelessness Agreement would do well to consider monitoring both rents and demand for private rental housing across the income spectrum, to ensure this Budget's impacts are being properly accounted for down the track.


Monday, February 6, 2017

The wrong kind of supply

When it comes to housing affordability, we have a bit of a mantra here at the Brown Couch: it's not supply and demand, but the type of supply and demand that matters.


Jennifer Duke's recent article in the Sun Herald shines another light on this. Drawing on data provided by Don't Rent Me's Anthony Ziebell, Duke writes:
The vast majority of apartments in NSW are two-bedrooms – with 2298 – followed by 1322 one-bedroom apartments. And in many suburbs, one-bedroom apartments aren’t substantially cheaper than two-bedroom apartments, forcing some tenants to change their wishlist.
Ziebell is a friend of the Brown Couch, and he's run his data by us as well. He points out that more than half of new rental listings across the eastern states of Australia are 1 and 2 bedroom units. In New South Wales it was at 56 per cent the last time he pulled this data, which he obtains by regularly scanning online rental advertisements. This data comes hot on the trail of our own Rent Tracker report, which last week showed how rents have climbed even in parts of Sydney where thousands of new rental bonds have recently been lodged, indicating growth in rental supply.

So what's going on?

Ziebell suggests activity in Australian housing markets places too high a focus on investors' interests, rather than housing need. From Duke's article:
Don’t Rent Me founder Anthony Ziebell warned too much of a focus on investors, rather than those who will actually be living in the properties, is leaving Sydney filled with “inappropriate” homes.  
“Sydney’s rentals are the smallest in the country,” he said.
“If you’re building an apartment block, how many one-bedroom apartments can you sell compared to three-bedroom apartments? 
“It’s not about providing suitable housing, it’s about getting the maximum profit. This is leaving renters without anywhere suitable to live,” he said.
He's onto something. But before we get to that, let's back-track to October 2013 - when first home buyers were still vaguely a thing, and Catherine Cashmore penned an article for Property Observer called Investors or owner-occupiers: who are we really building housing for?. (Hint: it wasn't owner-occupiers then and it's not owner-occupiers now.) Cashmore was talking about conditions in Victoria, but the general themes could be applied anywhere:
The relatively small one and two bedroom units featured as 'affordable' tend to fall into the investment sector of the market, not just because of tight lending restrictions banks impose on first home buyers for this type of accommodation, but also due to high owners’ corporation fees set aside to service the lifts and other security features.
A great deal has happened since 2013, including the steady decline of first home buyer activity and a slowly rising interest in the plight of the poor old renter. But as we can see, those still standing in our dysfunctional housing system are yet to catch on. Or perhaps they just don't want to?

Like others, we've often cited the ABS Lending and Finance data, as we did in December 2013, to show that about 92% of money lent to property investors goes towards established dwellings. The remaining 8% contributes to new supply, as landlords are far, far more likely to trade in existing housing stock than invest in new construction. Property investment finance has more or less continued in these proportions despite recent development activity.

Even so there are considerable chunks of money being poured into new apartment blocks by investors, and this has been particularly so in areas close to jobs and transport over the last couple of years. Whether these dwellings are purchased by investors 'off-the-plan' or through a subsequent sale is beside the point for this discussion. What's not beside the point is that development is being propped up - if not driven - by this investment, and investment is being driven by something other than what Australian households need.

So what's driving investment?

We've written extensively about the impact of federal tax settings on the type and nature of investment in Australia's residential property, so we won't go over it again today. Suffice to say that it has changed the shape of the rental market. Investors purchase dwellings with prospects for capital gains in mind rather than any consideration of need or demand from tenants.

The recent insights from Don't Rent Me and the Tenants Union are yet more evidence of this.


Thursday, July 14, 2016

The rent myth: measurement and supply

Domain are running an interesting article today, suggesting it's only a matter of time before apartment rents start to dwindle and we can all live happily ever after.

It starts:
Record high-rise building in Sydney has yet to provide any relief for renters, with apartment rents jumping sharply in the June quarter, data shows. 
The median weekly advertised rent for an apartment in the harbour city is now $520 a week, just $5 cheaper than houses, according to Domain Group’s Rental Market Report released on Thursday. 
But experts are predicting the trend will turn around as a record surge in apartment developments are built, mainly owned by investors looking for tenants.
This raises a couple of points worth exploring.

The first is the way organisations like the Domain Group measure rents - they check the property pages to see how much landlords are asking. This gives a skewed view of rents, as landlords don't always get what they want, and rents are not always quite as high as these reports suggest. Not only can this paint a misleading picture of life on the treadmill, but it can lead to inconsistencies in the reports themselves. For instance, the Domain Group's report from June 2015 had house rents at $530/wk, but by September this had been revised down to $525/wk. The latest report has kept house rents at $525/wk for that period but says they are now at $530/wk, showing an increase of 1% over the year. We're not sure why they do this exactly, but it happens from time to time. No doubt they have their reasons.

A much better way to measure rents is to look at how much tenants are actually paying, and it's possible to do this in New South Wales by checking the bonds that are being lodged with the Rental Bond Board. Our Rent Tracker series does just that - it's worth a look if you're ever wondering how actual rents have been moving in your area.

The second point is that building new blocks of apartments does not automatically reduce the rent - especially not before they're finished. To be fair, the Domain article does acknowledge that the bulk of new building has not yet been finished, with First Home Buyers Australia's Taj Singh saying:
Despite the record levels of apartment building … a lot of the new supply will be coming onto the market later in 2016, with most of the supply to come on the market 2017.
Singh is right - it really is too early to say how "record levels of apartment building" will impact on rents across the board. But we can look at parts of Sydney where the private rental market has grown, and see what the effect has been there. Looking at the number of bonds lodged between 2010 and 2015, as well as how much rents have increased over that time, tells us that a growing rental market does not always bring the rent down:

  • Camden saw a 57% increase in the number of bonds held, and rents went up by 21%
  • Botany Bay saw a 52% increase in the number of bonds held, and rents went up by 45%
  • Auburn saw a 41% increase in the number of bonds held, and rents went up by 20%
  • Maitland saw a 36% increase in the number of bonds held, and rents went up by 9%
  • Blacktown saw a 34% increase in the number of bonds held, and rents went up by 19%

By comparison, the following areas saw much lower growth in the rental market:

  • Blue Mountains saw a 1% decrease in the number of bonds held, and rents went up by 25%
  • Leichhardt saw a 1% increase in the number of bonds held, and rents went up by 20%
  • Waverley saw a 2% increase in the number of bonds held, and rents went up by 21%
  • Mosman saw a 3% increase in the number of bonds held, and rents went up by 23%
  • Manly saw a 3% increase in the number of bonds held, and rents went up by 30%
An article from the AFR earlier this year looked into this in some depth from the perspective of a Chatswood bound house-hunter - it begins: "A long queue is usually a sign something of value is at the end of it. That wasn't the case in Sydney's Chatswood on Saturday". It's worth revisiting.

There are two problems at play here. The first is that it would take even more "record levels of apartment building" to make up the required shortfall, and the second is that new supply is usually dropped into the mid- to high-end of the market, coming at the expense of more affordable homes that have been demolished to make way for something new.

We'll have a closer look at these two problems a little way down the track.

Wednesday, June 29, 2016

Rent Tracker

Over the last few years we've been looking at various ways of measuring rents in New South Wales, and pointing out that there is a really powerful source of data to which of us tenants who pay bond contribute.

The Rental Bond Board holds nearly 800,000 bonds and each one tells a story - what the rent was for a particular property at a particular time in a particular location. If you add all of those stories together, you get the Rent part of the Rent and Sales Report, as published by Family And Community Services.

Today we released the report version of Rent Tracker. We've dug in to the Rent and Sales Report and drawn out extra data, to help give more context to changes in rents. We've also looked at advertised rents as well as the actual rents, to help add depth and understanding to the stories reported in the media.

This data source should be seen as one of the go to sources of information about what is happening in renting. It's important to know what landlords and agents hope to get for a property they advertised, but it's at least as important to know what they actually do get. As well as ongoing improvements to the report, we'll keep blogging about how this data can help understand the state of the rental market!

Check out Rent Tracker here.

Friday, June 24, 2016

Will rents rise if Australia votes for tax reform?

We've heard that some people - let's call them real estate agents and a couple of prominent politicians - have been saying rents will rise if Australia votes for tax reform. We thought we'd better check this out.


We've already looked at how negative gearing and capital gains tax discounts distort the rental market at a macro level - you can read about that here - so it's hard to know exactly what these soothsaying ne'er-do-wells are getting at. Affordable rental housing couldn't really disappear from the market any faster than it already does. And if the current reform proposal does get up, existing arrangements will not be affected, so current landlords would not be able to use the old "suddenly I am paying more tax, and I must pass this unexpected cost on to my tenant" excuse.

Still, we can't shake this feeling that, should it come to pass, landlords could try to use a new tax regime as a screen for putting up the rent. Real estate agents' bottom lines would benefit from higher rents, and because they favour the status quo they have nothing to lose from cultivating an expectation that change means rents will increase...

One of the first claims you'll hear a real estate agent fall back on is that rents took off after Paul Keating made some adjustments to negative gearing back in 1985. If it happened then, they say, it will happen again. Never mind that the claim has been contested and discredited time and time again - see, for example, this 2003 article from Ross Gittins, which discusses rents rising in Sydney and Perth in the late 1980's, but not in other parts of the country; or this more recent piece from the ABC's Fact Checker, which reaches a similar conclusion before quoting a 1987 Cabinet Submission:
With the notable exception of Sydney, conditions in the residential rental property market are not unusually tight. The evidence suggests that local influences, rather than tax measures, dominate in metropolitan rental markets.
The Fact Checker article goes on to examine some of the "other influences" that could have been contributing factors. It cites high interest rates as well as high prospective capital gains in other investment classes, making residential property a less attractive option. But one of the influences that hasn't been mentioned is the impact on rents of residential tenancies legislation at the time.

Keen followers of renting law reform will know that tenancy agreements in New South Wales were not regulated by the Residential Tenancies Act 1987 until it commenced in 1989. This means that back in 1985, putting the rent up in Sydney was much easier than it is today. Landlords would simply offer a rent increase, and if the tenant didn't accept it they'd usually get a notice to quit and have to move out. But some other states - notably Queensland, Victoria and South Australia - had brought in new renting laws somewhat earlier. Which means that rent increases were better regulated in other parts of the country while Keating was tinkering with tax, and Sydney rents were doing their thing...

Of course, renting laws still vary from state to state, and tenants in some states may again be better equipped to handle wholesale rent increases than in others. Even so, to the extent that rents are now regulated, they are still very much tied to "the market". Landlords set the rent based on what tenants are prepared to pay, and if a tenant challenges an excessive rent increase it is generally decided by a tribunal with market comparisons in mind. But the important thing is that such a challenge is possible, and tenants should not hesitate to exercise this right if the need arises. This right was not available in Sydney in the mid-1980's.

Landlords who claim they will set rents according to tax policy, rather than market factors, should have cause for caution. Rents continue to reflect a fine balance between vacancy rates and tenants' incomes, and landlords cannot move the market by sheer force of will. Thankfully, those bad old days are over.

Nevertheless, we expect there will still be some landlords, real estate agents and politicians who continue to insist that tax reform will result in rent increases. Here are a couple of useful points to keep handy, just in case you ever find yourself in conversation with one:

Rents are not tied to other costs
Rents increase faster than the general cost of living. We'd have thought this was common knowledge, but SQM Research's recent report suggests perhaps it is not - they've suggested Labor's tax reform proposal could lead to "an acceleration in rents above and beyond the CPI rate". But here's what rents already look like against CPI, over the last quarter of a century:

Rents v CPI, from the TU's Rent Tracker (coming soon!)
There's been plenty of "above CPI acceleration" in there, even without tax reform.

We also know from tax data that rents increase faster than landlords' costs. We explored this in our report 5 years of the Residential Tenancies Act:
... landlords collect significant amounts of income from their tenants each year. In the 2009-10 financial year landlords declared $9.7billion in rental income for properties in New South Wales. This increased to $12.1billion in 2012-13. An increase is to be expected given the growth of the sector, but even so this represents approximately $2,175.00 more rent to landlords in 2012-13, per property, than in 2009-10. The average costs declared by landlords over the same period rose by $880.00 per property.
So we can conclude - rents go up because they can, not because they need to, and certainly not in response to any particular cost factors for landlords.

There's no room in the market for higher rents
Rents go up because they can, unless for some reason they can't. At some point, rents become unaffordable, and tenants cannot continue to pay them. When this happens, tenants are forced to find homes in a more affordable area, or they're forced to share a home with others. In their 2013 report Long term private rental in a changing Australian private rental sector, Stone, Burke, Hulse and Ralston found that families with children now make up the largest group across Australian private rental markets. These households may not be inclined to share, which means landlords need to keep rents within their reach so as not to price them out.

None the less, the report also shows that the fastest growing group is shared households. Tenants are increasingly responding to high rents by pooling their resources and living together. Further research suggests that share housing is not the domain of young people alone, with a marked increase in the number of people over 40 recently using the share house finding website flatmates.com.au...

Meanwhile, the Rental Affordability Index continues to reflect the grim reality of high rents across the country. The RAI reveals that under current conditions, low-income households typically need to pay 50 to 85 per cent of their income on rent. And as we showed in another recent post about rents, even a modest - and much needed - increase to Commonwealth Rent Assistance couldn't open the gate for higher rents.

If tax reform happens and the rent goes up, who's going to pay it?

Landlords really, really need the rent, and so do their banks
Even though rents are no reflection of costs, it's really quite expensive to be a landlord. As we discussed in our Tenants' Guide to Tax Reform, their biggest expense comes from the purchase of a property in the first place. According to tax data, the interest payable on loans amounts to more than all other expenses combined, even with record low interest rates:

Landlords' expenses ($billions) Source: ATO
That's not surprising when you consider that banks have been lending, on average, more than $550million to Australian landlords each month for the last year.

If landlords were to increase the rent beyond what the market could bear, or even beyond what the market can anticipate, many would start to experience periods of vacancy. Even a short-term loss of rental income could have serious consequences for landlords - at best it would affect cash-flow arrangements and compromise their ability to meet a mortgage commitment without making other sacrifices; at worst it would lead to mortgagees calling in bad debts.

So, all things considered, if you come across a landlord, real estate agent or politician who insists tax reform would lead to higher rents, we reckon you should call their bluff.


Thursday, June 16, 2016

The rent (assistance) is too damn low

Sydney, we have a real problem.

The rent in Sydney is so high now that even historic pockets of affordability are way out of reach for people doing it tough. We might have been able to rely on public or social housing if supply had kept pace with the growing population, but it didn't.

That shortfall has combined with pressure from moderate income households - also desperately trying to keep their budgets in check - and landlords taking full advantage to meet their exorbitant interest costs, to squeeze this city dry of affordable rental housing. The most graphic way of seeing the impacts for the last few years has been Anglicare's Rental Affordability Snapshot. Now we have a second way of showing the problem in the form of National Shelter's Rental Affordability Index. Sydney is a sea of red and orange, showing the lack of affordable options.
Sydney's rental housing. The redder it gets, the cheaper it ain't.
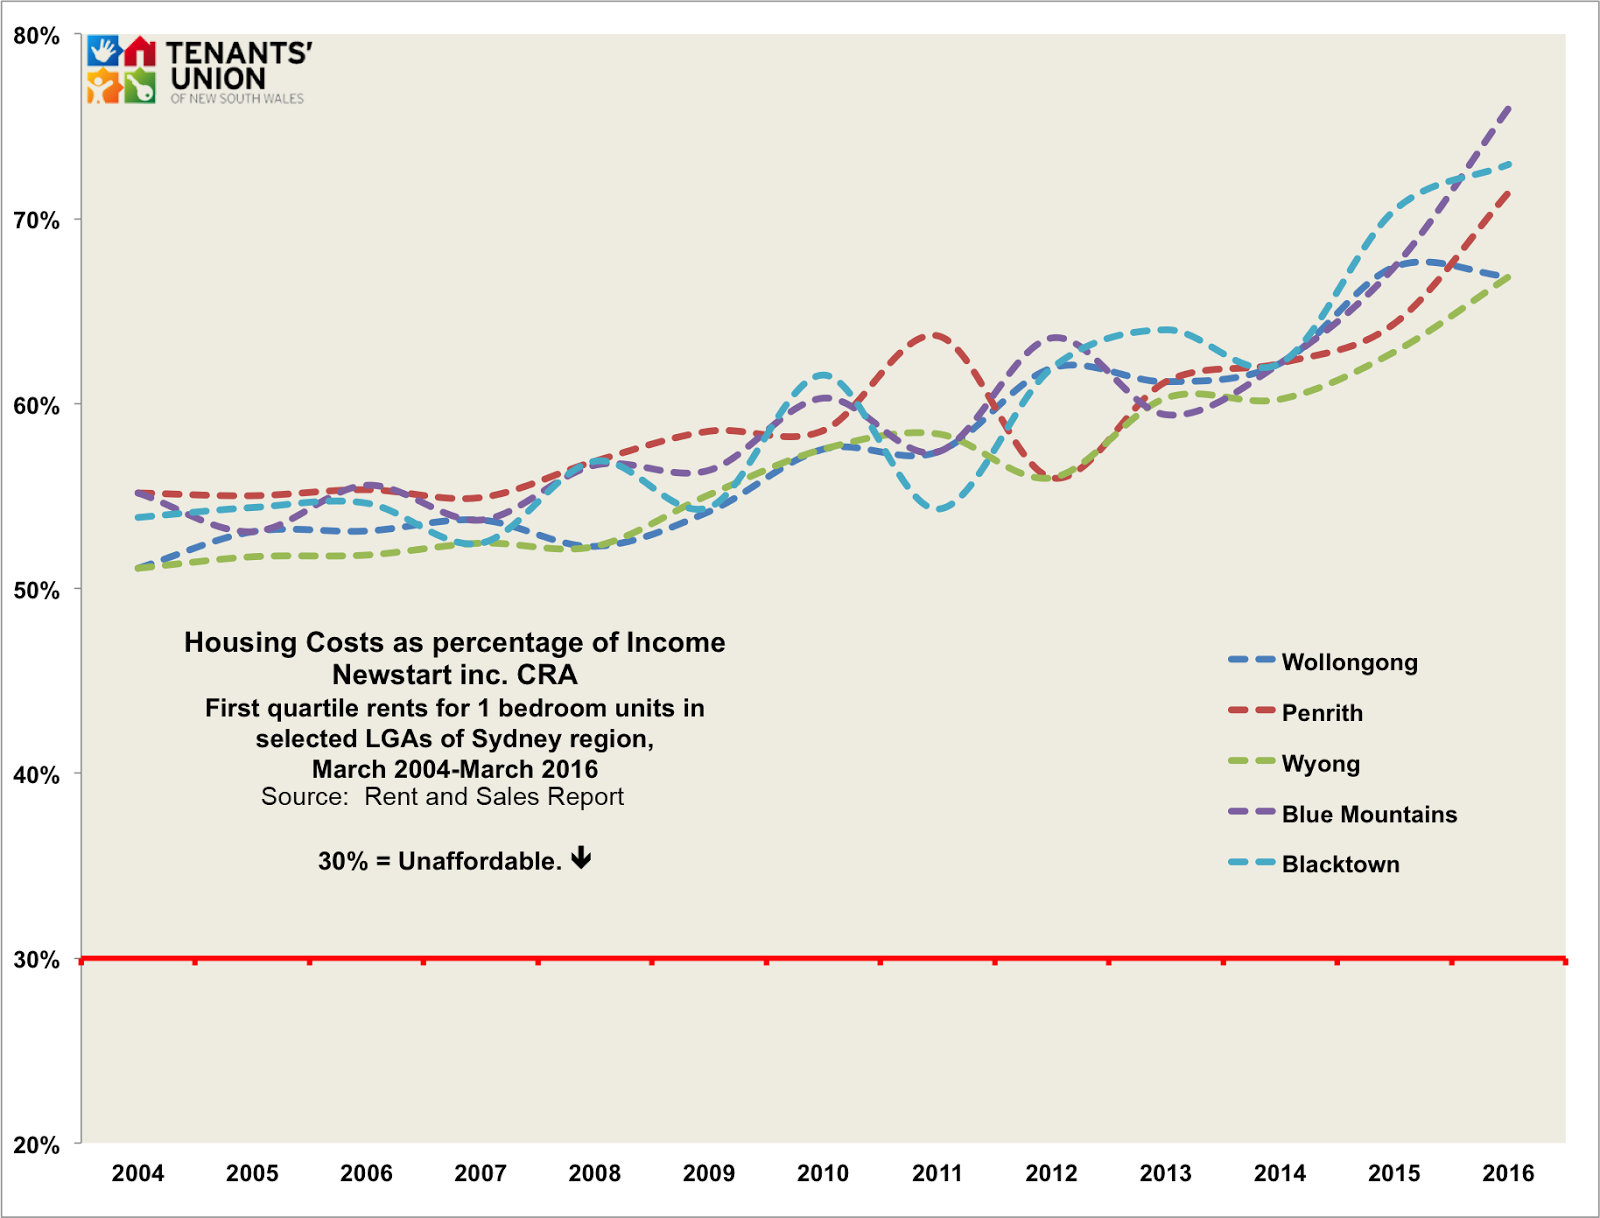
At the fringes there appears to be some hope - green looks promising, if you receive close to a moderate wage. But we wondered about tenants surviving in this city on Newstart, and receiving Commonwealth Rent Assistance (CRA). We crunched some numbers, and the news is not good.

We've looked at how much a one bedroom apartment would cost to rent in some of the more traditionally affordable parts of Sydney and surrounds, and compared it to the income a single person person receives on the Newstart allowance, plus CRA. We can see the numbers going back to 2004 when the Rent and Sales Report began reporting on first quartile rents for each Local Government Area. The "first quartile" in this case is the level of rent halfway between the lowest rent for new bonds lodged in March of each year, and the median, or middle rent.

We chose these five Local Government Areas as being both historically and currently some of the most affordable areas of the Sydney region, as well as representing the northern, southern and western areas within a relatively accessible distance from the city.
Clearly, Rent Assistance has never been about paying the rent in full. But it does make a real difference in bringing a home within reach for a lot of us who would struggle even more without it.

Click image for larger version
Government figures show that more than a quarter of people in NSW who receive rent assistance would pay more than 30% of income if not for CRA, and 15% would otherwise be paying pay more than 50% of their rent. However, in NSW we are still left with 15% of people, or nearly 70,000 tenants, who are paying more than 50% of their income even after receiving CRA.

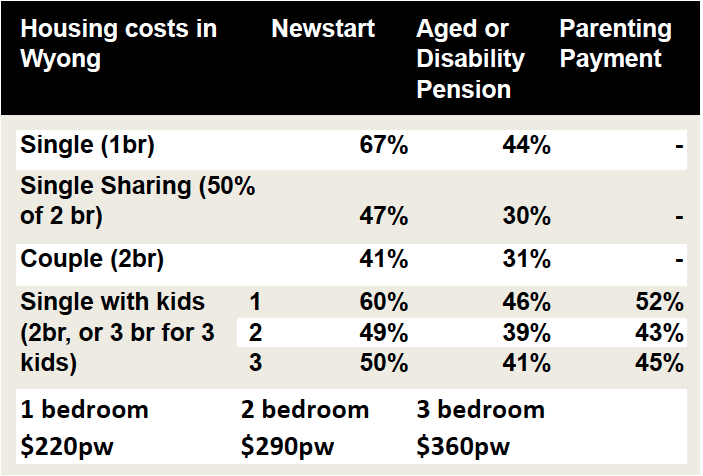
The #votehome campaign is calling for a 30% increase in rent assistance. What would that look like? We've applied that to a few different household types in Wyong, the cheapest LGA for lower quartile rents in Greater Sydney. These figures show what percentage of income is taken up by rent after receiving CRA. Remember, anything over 30% is considered unaffordable if you receive a low income:


With a 30% increase in CRA:


OK, it may not look like much, but it translates into around $20 a week more to spend on food, utilities, clothes or health. While the other income support payments look better, it is important to keep in mind that people living with disabilities, and those with kids do have other expenses that can really stack up. Ultimately, Newstart is just inadequate as a payment and needs to be increased, but an increase in rent assistance will still make a substantial difference.

You can support the increase by signing the #votehome petitions here.

The rent figures were derived from the Rent and Sales Report. We'll be releasing the first edition of Rent Tracker shortly, where we'll dig in to the reality of rent prices in NSW and explore the wealth of knowledge that the tenants of NSW provide simply by paying bond.

Thursday, September 10, 2015

Whose price is right?

Domain, the bible of Sydneysiders who attend dinner parties in journalists' imaginations, recently released another piece of high conversation fodder - its price data tool. This allows you to search nearly any address in Australia for information on its estimated rent and sale value, as well as its history on the market. It was presumably constructed using the mass of property sales data the NSW Government pledged to release earlier this year.

It certainly has novelty value. Search your friend's place. Search your neighbour's place. Search Kirribilli House. And did you know the tiny inner city terrace your correspondent's mum bought for thruppence and a rusty nail in the 80s could now get you a medium size island?

Rent this charming sandstone mansion with 180-degree city views for only $1140 a week (estimate)!

But beyond snooping, renters should note that the Domain tool, and the clones we're sure are in the pipeline, could change the issues relevant to rent increases.

This Leichhardt two bedder provides a fine example. The property history shows that it was let for $550 a week as recently as July 2015. As one might expect for a property that is a fixture on the rental market, this is the end point of steady increases in recent years. The current price is $80 higher than in 2012, $100 above the 2010 mark, and a full $175 more than the going rate back in the Bronze Age of 2007.

So $550 is a reliable marker for current market rent, right? 

Wrong - at least according to Domain. The price tool estimates with "high confidence" that the going rate should in fact be $650 per week. This is based not on data concerning the property itself, but on advertised rent prices for similar properties elsewhere in Leichhardt.

So if a hypothetical tenant's hypothetical landlord were to issue a rent increase of $100 per week, citing the price tool as evidence of a property being rented at well under market value, would our hero be advised to dispute the increase as excessive? There are of course a great many variables this scenario cannot consider.

But it does raise interesting questions. Isn't 'market value' just the price a consumer is willing to pay, rather than what a vendor is hoping to collect? If so, the fact this property has consistently gone onto the rental market, and is currently fetching $550, suggests that this is indeed market rent. Or is the whole of market picture, suggesting a similar place in the same suburb goes for $650, in fact a more reliable guide to 'true' value?

There are also obvious problems with Domain's use of advertised rather than actual rents in coming to its figure of $650. There is absolutely nothing to suggest the agents of the inner west were able to obtain the advertised prices on the properties used to calculate the price tool's estimate. This is something we've discussed in earlier conversations on the the Brown Couch.

These may well form the parameters for landlord-tenant deliberations and confrontations to come. For what it's worth, we think our tenant stands on solid ground. But a result the other way is not out of the question, particularly if the case winds up at a Tribunal hearing. These are notoriously difficult for tenants to win, and the Residential Tenancies Act affords Members substantial leeway to come to their own conclusions about what is and is not relevant in contemplation of an increase. 

As we've noted elsewhere, the Minister responsible for Fair Trading is required to undertake a review of the Residential Tenancies Act 2010 this year. We believe the rules around dispute of rent increases as excessive need reform. Particularly relevant to our hypothetical is that the evidence burden for rent increase matters is always on the tenant, who must show that the disputed increase is in fact excessive. We say that where an increase exceeds the CPI - as would be the case in our scenario - the burden should be on the landlord to show that the increase is not excessive. This would put our tenant on much safer ground, and prevent increases of dubious merit from happening.

We note finally the the price tool may also struggle outside the confines of the city, though for different reasons. With far less data, both area and property-specific, available for regional housing, it's not hard to see that the program will produce estimates based on very little information. This is likely to produce further anomalies and inconsistencies, and therefore arguments of its own. 

Read the Tenants' Union's full submission on reform to rent increase provisions here.

Friday, July 31, 2015

Caution following REI's lead over rent drop

Breathless good news on rental affordability from Tele land this week.
Citing Real Estate Institute of NSW data, the state's favourite tabloid told us that rent in some of Sydney’s blue chip neighbourhoods – including Bondi Junction, Neutral Bay, and Manly – is down by between $25 and $70 per week.
REI president Malcolm Gunning attributed this fall to a ‘glut’ of new apartments released onto the market in 2014. 
A strong second quarter does not a triumph make
But we suggest caution before jumping to any of the same conclusions. Whilst REI data is not freely available to the plebeian blogosphere, it’s worth noting that the basis for the article’s claims appears to be a REI study of the second quarter of 2015 alone. This is a perilously short period of time from which to be drawing any bold conclusions such as these.
What's more, as the second quarter takes place over both a university break and the feared ‘polar vortex’ period, autumn and winter variations for rent in student and waterfront neighbourhoods are also relevant. Indeed, of the ten suburbs cited in the article, six are beachside or waterfront, and two are situated in the immediate vicinity of Sydney University or the University of New South Wales. Bondi Junction arguably fits both criteria.
Remember too that REI data is based on asking rather than actual rents. As we noted recently, this paints a misleading picture of the market. Far more reliable is the equivalent data in the Rent and Sales Report – based on the rent paid in new tenancies, as discerned from rental bonds lodged with Fair Trading (i.e. almost all of them). And published free of the desire to push any particular narrative. 
That, too, is a quarterly publication, with the second quarter edition due in a tantalising 21 days. We will wait on its findings before making any breathless conclusions of our own.

Thursday, July 9, 2015

Highest rent increases in 5 years?

There are a few things to keep in mind when reading these articles. Let's have a closer look.

Domain use asking rents, not what places actually go for. As discussed in our rent tracker articles (more to come!) RBB data is a much better data source because it records what rent places are actually going for.
If we go back a year into the Brown Couch archives, we can put into context Domain's claim that this is the highest rent increase in 5 years.


For more than 2 years, Domain (APM) had houses pegged at 500 per week. That spike in September 2012? That is actually a higher percentage jump than the one reported today (a full 2% rather than the 1.9%). More importantly, they are both $10 a week- so the same dollar value. That jump was also described as the highest increases, as was the subsequent rise in March 2014.

The real story was seen in the authoritative Rental Bond Board data, which showed a more regular set of increases with some large jumps over 2014.

Now let's dig a little deeper into the reporting. While house rents were reported as increasing with the usual hyperbole not a peep was heard in the article about apartments. Guess why? Check out the quarterly change in apartments below. 0% rent increases. We'll wait for the release of the June Rental Bond Board data, as again there may be a different story in the real world, but it doesn't fit with Domain's narrative, so it doesn't rate a mention.


Dr Wilson, the senior economist at Domain Group, says some other things worth challenging in that article too: "We would have thought that given that we have record numbers of investors, supply might have caught up to demand, but the new supply just can't match the demand," he stated.

There are two things to notice- a record number of investors does not automatically translate into new supply, it could just as easily mean less owner occupiers. The low rate of first home owners buying in would suggest that may be a likely scenario. While we're at it, the low rate of first home buyers becoming first home owners is not to blame for rent increases- they're not the ones setting the rents!

More importantly though, most new supply, particularly investor-driven supply, is in apartments, not stand alone houses. Domain's data shows very flat growth in apartment rents. We're surprised they missed that.

The real deal
What this data, and the Rental Bond Board data doesn't show is what is happening to the people already in their homes. To an extent, the CPI rent index might capture some of that, but it is mixed in with new rentals as well.

From our Housing Affordability Survey of 2014, and many subsequent conversations with tenants, what is clear is that people are worried about making a fuss about various issues with their houses, because of possible termination or rent increase. Both outcomes lead to another data point for Domain and the RBB data as it is unlikely the rent will stay at the same level between tenants.

Also we'd like to point out that not everyone who rents is a frustrated home owner- many people who rent are just frustrated home makers. A recent article put it marvellously
"The point of the iconic quarter-acre aspiration in the Australian psyche is not the actual white picket fence or the big backyard; it’s stability and comfort. Our rental market is the opposite not because of the large number of apartments, but because a sense of ownership and security is virtually impossible for many."
As more people stay in rental market for longer, government should consider making that stay more comfortable. They can easily do so, and soon.

-------------------------
For more on the Tenants' Union platform of fair Rent Increases and more, check out our Just Renting policy page.

Wednesday, December 17, 2014

Rent Tracker - Sneak peek

We've previously written about the various ways people can track rent movements in Sydney. We plan to continue this practice in our new series "Rent Tracker."

This is a brief sneak peek while we work on adding all sorts of improvements. We've two substantial changes to note.

Previously, we tracked the 'asking rents' reported by APM against the rents tenants actually pay, as presented in the Rent and Sales Report and in the CPI - Sydney Rents series.

For this and subsequent issues, we've added two new 'asking rent' trackers - CoreLogic RP Data (until very recently known as RP Data), and SQM Research.

To make it easy for you, we'll be keeping these colours for each series in all our graphs! Clicking on each graph will get you the bigger version.
First, let's introduce CoreLogic RP Data and SQM Research.

Both are independent data researchers that primarily focus on property. CoreLogic is an international group that acquired RP Data in 2011, but only recently changed the name to match.

We will primarily be looking at RP Data's Quarterly Rental Reviews, or Quarterly Property Reports where the Review is unavailable.

SQM Research publishes a Weekly Asking Rents Index on their website, which will be the source of data for them. SQM publish prices for all houses, and 3 br houses, all units and 2 bedroom units. For consistency with the other measures, we will be using their all houses and all units measures. SQM publish a methodology for their index here.

Both CoreLogic RP Data and SQM Research primarily scour property listing websites for asking rents to gather their data.

Sydney Rents

First, median rents for houses and units for the last 18 months, and the difference between asking rents and actual rents is noticeable.We've adjusted for inflation to September 2014 here, which produces a flatter image, though the slow rise is clear as well. 


SQM prices houses at a much higher level than other data houses, we'll be seeking comment from them. Interestingly, their unit prices are lower than even the Rent and Sales Report.


We're also looking at producing a couple of indexes to try and give an broader perspective on the narrative that gets played out in the media whenever rent prices are reported on. The following graphs show one of two ways of we'll use to indexing our five data series. The indices purpose is to try and represent movement, rather than merely the data points of the series.


These indices demonstrate the relative movements of rent prices together. This represents clearly that the actual rents have been rising much faster than the asking rents would suggest, particularly in houses, and particularly with APM but certainly all three asking rent series show flat periods while the actual rents catch up. This becomes an issue when the media narrative describes flat periods in prices, when we should be talking about how much more unaffordable rents are getting!

We'll begin to look at what all this means in the New Year, and look forward to bringing you more numbers, including regional reporting, in subsequent instalments!