Showing posts with label Research. Show all posts

Thursday, October 11, 2018

Renters can't get no satisfaction - but we try and we try

This week the Bankwest Curtin Economic Centre published a new survey about the private renting sector. The survey reports some important but unsurprising results around the unaffordable and unstable nature of the sector. However it found some unexpected results and it is this which the authors concentrated on.

Let's dig in to these results, but first we invite you to keep in mind this line from the excellent English book of 2016 "The Rent Trap."


This goes a long way to explain how on one hand the survey found that "only" 6% of tenants reported their premises being in poor or terrible condition and 14% were unsatisfied with the experience of renting. On the other hand:
  • 35% reported the place needing maintenance internally,
  • 27% externally,
  • 21% of renters reported their properties were affected by mould, 
  • 30% had inadequate security
  • 12% reported their homes did not even have smoke detectors installed.

26% of those renting from a real estate agent reported either repairs only occurring after constant reminders, or never being carried out by the landlord or agent at all. The discrepancy between such poor results and the satisfaction level demonstrates the adjustment renters have already made to their expectations.

That so many were willing to still describe their relationship with their agent or self-managing landlord (69% and 81% respectively - a good moment for self-reflection from the real estate industry if they felt inclined!) as good or excellent says a lot about how little many tenants expect from the relationship. It also leads in to one of the big issues with the survey methodology - definitions. We could offer feedback on many aspects of the survey, but let's not turn this into a full review!

What is an "average" relationship with a real estate agent? What is a lease? 

Several parts of the survey with "surprising" results are based on language which is not necessarily universal.
An average or even a good relationship with an agent may mean different things to different people. Is an average relationship the colloquial, and largely negative usage? Is it what a person expects everyone else is experiencing, or compared to my previous, really horrible relationships? Or is it, as this scale suggests - a halfway point between good and poor? The different definitions may give quite different results. For some, a good relationship may simply mean they have not yet had a bad experience.

There is a very large drop-off from "average" ratings to "poor" and "terrible". People experiencing poor and terrible relationships are much more likely to have either been forced to move or chosen to move to avoid the relationship. So the current improved relationship masks a previous negative relationship. This would go a long way to explaining the high proportion of positive relationship. Unfortunately the researchers divide people into being forced to move or choosing to move. However, a move by choice does not appear to allow for a person who is informally forced to move because of a poor relationship, lack of repairs, or other issues. 

A lease is probably most commonly understood by tenants to be a formal written contract, and particularly a fixed-term contract. In a legal sense it refers to the temporary transfer of particular property rights from one person to another in exchange for rent. Respondents answering a question about renewing a lease might have been thinking of the fixed term, rather than leaving the home, which would change the way a person would answer the question. In many states it is routine for the fixed term to continue on into a periodic, continuing or non-fixed (language varies across the country!) lease whereas in Queensland almost all tenants are in rolling fixed term contracts.
Some of the questions around leases and decisions conflate the two and ask questions asking, for instance, why a lease was not renewed.  If a respondent was thinking of the initial written contract, again this may throw up odd results.

Are we satisfied?

In many ways, we are left with more questions than answers about the research. Digging a bit deeper into the data would likely do a lot to tease out the meaning behind the responses, but unfortunately it's not really available to do so. One key factor which would seem to have been relevant was responses from different income ranges. Unfortunately none of the responses (not even affordability!) did so. 
Satisfaction is a tricky thing to measure. It may have been better to concentrate on the measurable experiences - how many properties in poor repair, how many tenants left to deal with repairs themselves, how many moves tenants are forced into moves, both formally or informally. This gets away from language differences and would ultimately give a much clearer idea of the renting experience.

Monday, October 1, 2018

International Older Tenants' Day


Artwork from a great essay by Anwen Crawford, 'Nowhere to go – older women and housing vulnerability', Right Now, 4 October 2016. She writes: ‘The number of older women who are rental tenants in Australia is growing, and these women ... are increasingly vulnerable to poverty and homelessness ... Housing affordability and security for rental tenants will only become a more pressing issue as Australia’s population continues to age.’
This year International Tenants’ Day coincides with International Day of Older Persons and is celebrated on Monday, 1 October.

On 22 May 1986 the Council of the International Union of Tenants met in Paris and designated the first Monday in October as the ‘International Tenants’ Day.’ The date chosen was made following a resolution by the United Nations General Assembly for a World Habitat Day, first celebrated in October 1986. Read more here. So, this year is the 33rd International Tenants´ Day.

Resolution 45/106, passed by the United Nations General Assembly on December 14th 1990, declared 1st October to be the International Day of Older Persons.

The United Nations 2018 theme aims to:
  • Promote the rights enshrined in the Declaration and what it means in the daily lives of older persons;
  • Raise the visibility of older people as participating members of society committed to improving the enjoyment of human rights in many areas of life and not just those that affect them immediately;
  • Reflect on progress and challenges in ensuring full and equal enjoyment of human rights and fundamental freedoms by older persons; and
  • Engage broad audiences across the world and mobilize people for human rights at all stages of life.
Accordingly, the International Union of Tenants has chosen the theme: “Sound, safe and suitable housing for elderly people” as this year’s theme for the International Tenants’ Day 2018.

There are currently an estimated 962 million people aged 60 or over in the world, comprising 13 per cent of the global population. It is predicted that this figure will have risen to 2 billion by 2050. Such huge numbers are likely to create many challenges, not least in housing the growing number of older people.

The International Union of Tenants has identified the following sub-themes for this International Tenants’ Day:
• An adequate supply of suitable, safe and sound housing for the elderly at affordable rents.
• The right to social and housing assistance to ensure a decent existence for elderly people who lack sufficient resources.

• A tenure neutral stance expressed through public policy could achieve wide availability of suitable rental housing alternatives for elderly people.

• Adaption of housing to suit the elderly. Many elderly people suffer from health and/or mobility problems. Therefore, many older people may have to leave their accommodation. Policies should support home adaptation for safe living without increasing the rents to a level where they become unaffordable.

• Urban environments should by designed as an inclusive urban environment by providing accessible services for the elderly. Public meeting places, shopping facilities and elderly care should be available locally.

• Understanding of the new developments in society and providing solutions for the growing number of single households. People may value privacy but not necessarily loneliness. Housing should be suitable also for the many people who live on their own.

• Prevention of accidents that happen in the everyday lives of elderly people (the majority represented by falls).

• The rate of financial effort related to housing increases from retirement age onwards. Many pensioners’ income is very low and/or has decreased whilst housing costs have risen and therefore housing policy must consider support structures for those tenants, including elderly people that may otherwise live in housing poverty or become homeless.

• Suitable facilities. Identifying the needs of people growing old at home and technical adaptations that may be carried out and new technologies that may be used. Tenants are particularly vulnerable as they may have no equity which they can release to finance adaptation of their homes.

• Ensuring that housing is sound and free of hazards and that they are suitably heated or cooled and maintained.

• Preventing vulnerability, in particular energy poverty and protection from crime and abuse.

• Including elderly people in decision making processes through the creation of participatory structures at national and at local levels. The planning of new housing developments and the adaption of existing housing should be supported by consultation processes with stakeholder groups.
You may read their full media release here.

So how is Australia doing on this International Day of Older Tenants?

Back in March of this year, The Brown Couch published ‘A longer lease on life’ here. It says that today across Australia more people are renting for longer periods. The reality for older renters is described by words such as : Overlooked, A distinct financial disadvantage, Condemned, Vulnerable and Financial stress … and that’s just for starters.

In July of this year Isabelle Lane at the New Daily wrote: 'Older Australians are falling off the housing ladder and face spending their retirement as renters, with the situation expected to worsen for coming generations.'

The Australian Housing and Urban Research Institute provides an excellent analysis of the situation facing older, low income tenants in the private rental sector. They also points to some current research. Check it out here.


Emma Power of Western Sydney University writes for The Conversation: 'Life as an older renter, and what it tells us about the urgent need for tenancy reform.'  The article is based on research findings presented in a talk by the author at an event, 'Fair for Everybody: Reforming Renting in NSW', hosted at Parliament House on Wednesday 26 September 2018.

So, on International Older Tenants’ Day, let’s particularly celebrate the contributions of older tenants whom we know. They may be a member of a tenants’ group, an activist in social housing or an advocate for the rights of residents in a land lease community. They are the back bone of the struggle for a fairer housing system. Often they are quiet about what they do day-in and day-out. But they are part of a worldwide movement!

Monday, April 30, 2018

Anglicare Rental Affordability Snapshot 2018

Anglicare Australia have released their latest 'Rental Affordability Snapshot' and find that the rental crisis is worse than ever. The Snapshot surveyed over 67,000 rental listings across Australia and found that there is a chronic shortage of affordable rentals across Australia. The Snapshot is consistently a powerful reminder of how tough it can be surviving in the rental market on lower incomes.

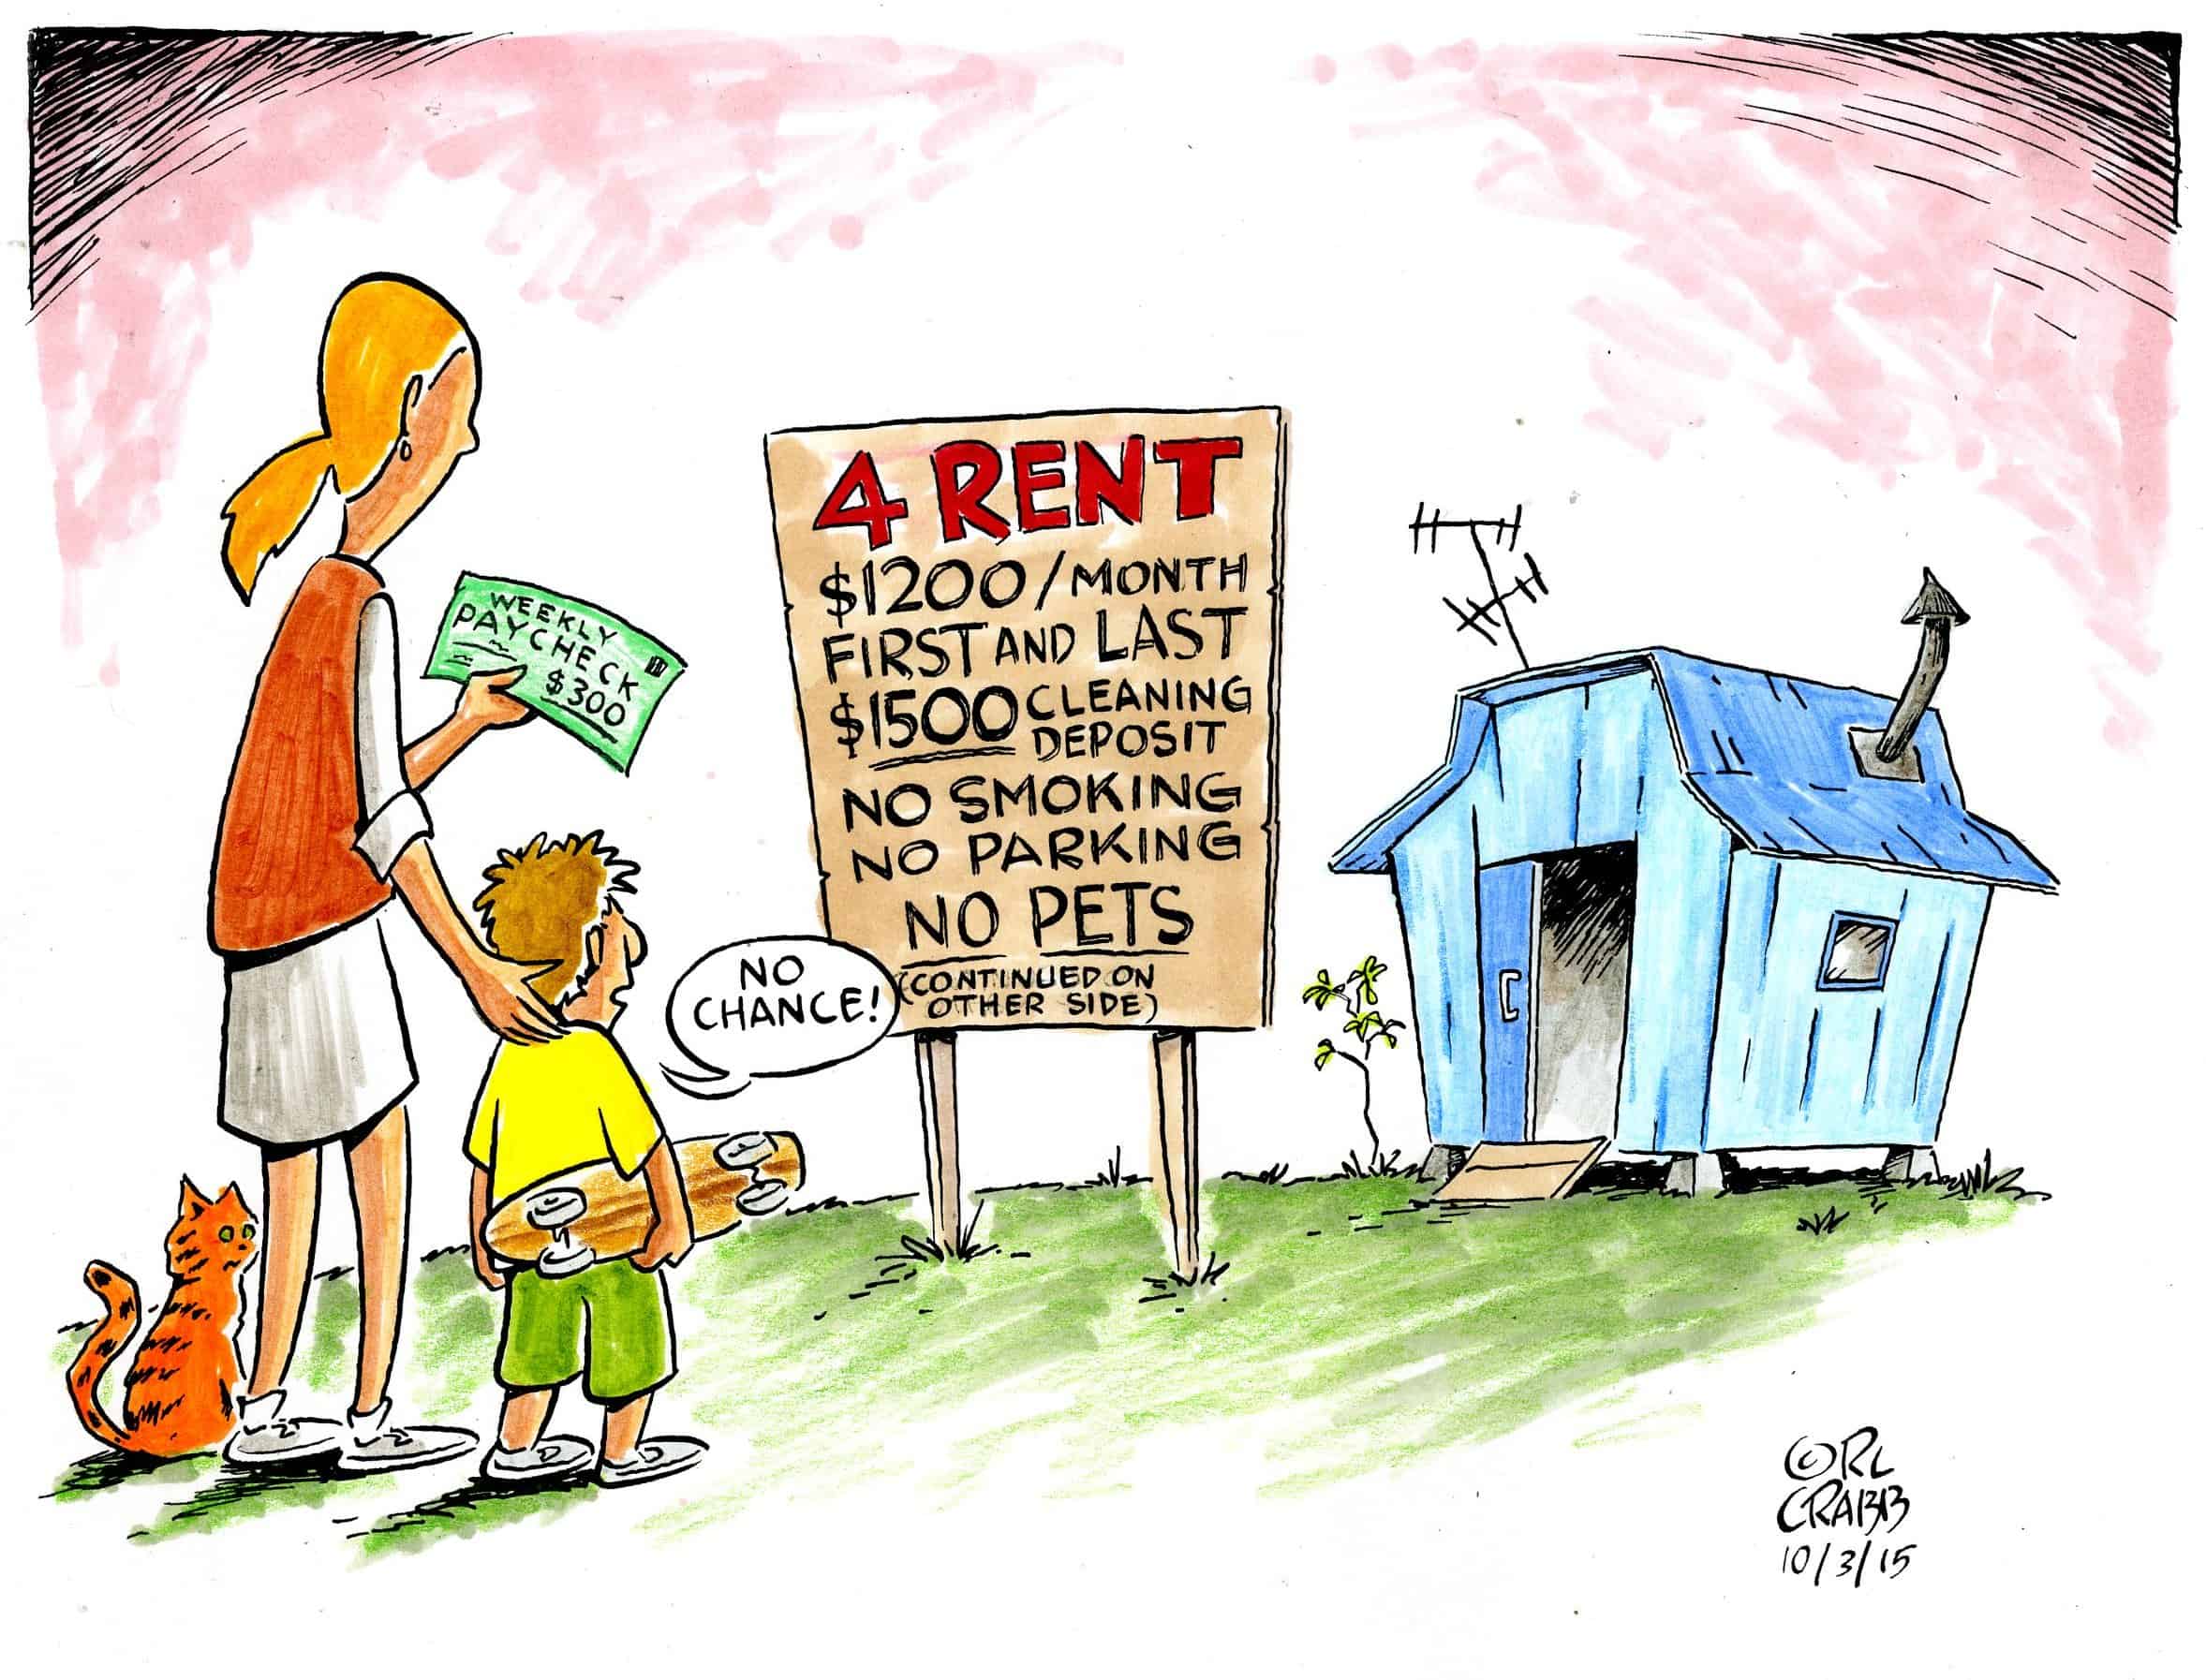
(C) RL Crabb 2015

We've had a look at the numbers for NSW - it's bleak.

Across Sydney, for any household type with children and relying on any form of income support there were 0 properties available and affordable for rent.

Across NSW, for any singles on Newstart or Youth Allowance there were 0 properties available and affordable for rent, including in sharehousing.

Across the rest of the country
– 485 rentals were affordable for a single person on the Disability Support Pension
– 180 rentals were affordable for a single parent with one child on Newstart
– 3 rentals were affordable for a single person on Newstart
– 2 rentals were affordable for a single person in a property or share house on Youth Allowance
– 0 rentals were affordable for a single person on Newstart or Youth Allowance in any major city.

One thing to keep in mind with the Rental Affordability Snapshot and most measures of rental affordability is that they are measuring the rents at the point people are moving. The complete absence of available and affordable options may weigh heavily in the minds of tenants who are living in substandard, inappropriate but not quite as expensive accommodation - what are their real options? Even if they were to move, would any one approve their application?

One of the findings of the report is that there are more rental properties available than before - but it hasn't helped with affordability. The market is failing to provide homes for people on lower incomes. What we need is a massive increase in the number of "market-proof" housing - housing supply which is aimed not at achieving the most profitable outcomes, but the most necessary. This is the role of good government - we hope they are listening!

Thursday, April 5, 2018

Wealthy landlords and more sharehousing: how the rental sector is changing

This article by Chris Martin, UNSW was originally published on The Conversation. Read the original article

[TUNSW comment: This research highlights the need for modernised renting regulations. Renting in Australia in the 21st Century is increasingly for everyone - but our laws are designed to entrench insecurity and diminish the ability of renting households to create homes for themselves.]

 More people are becoming heavily indebted by buying rental properties and shared accommodation is flourishing, as third party tech platforms help people find a place without a real estate agent.
A new report from the Australian Housing and Urban Research Institute explains how the private rental market is changing over time for both landlords and tenants.

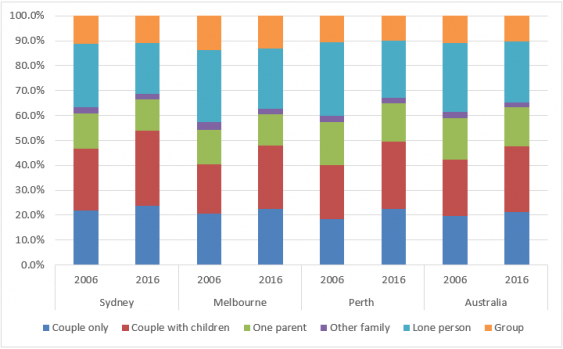
Over the 10 years to 2016, the number of renters grew 38% - twice the rate of household growth. More renters now are couples, or couples with children, so it seems the sector is shaking its image of unstable housing or perhaps these people are left with few other options.

Households by type, 2006 and 2016
 
The report analyses data from the 2016 Census, the 2013-14 Survey of Income and Housing and the 2014 Household, Income and Labour Dynamics in Australia (HILDA) Survey. It also draws on interviews conducted with 42 people involved in all aspects of the private rental sector: financing, provision, access and management.Rental property ownership also grew. We found the number of households with an interest in a rental property grew and the number that own multiple properties grew slightly as well.

But the typical landlord is still the conventional “mum and dad” investor. Two-thirds of rental investor households have two incomes, and 39% have children.

However they are also mostly high-income and high-wealth households: 60% are in both the highest income and highest wealth bracket. Interestingly, about one in eight landlords is themselves a private renter.

Housing finance ($A), 2000 - 2016

The biggest change in ownership is in finances: owners of rental properties are relying more heavily on debt.

Financing rental properties


The people we interviewed highlighted the Australian Prudential Regulation Authorities’ (APRA) guidance to lenders on loan serviceability calculations as having the greatest impact on overall investment levels and investor decisions.

Adding to the complexity is the proliferation of intermediaries, such as mortgage brokers and wealth advisers. These advisers are telling borrowers what lenders and loan products to use to maximise their borrowing power and negotiate lender and regulator requirements.

Houses are the most commonly rented in Australia, but everywhere rental markets are moving away from this and towards dwellings like apartments.

There’s now more diversity in rental properties too. For example the building of high-rise student accommodation, “new generation boarding houses” and granny flats.

These allow landlords to house more people in the one building, increasing revenue and making management more efficient.

The informal sector of shared accommodation appears to be flourishing, like improvising shared rooms and lodging-style accommodation in apartments and houses.

Finding a rental


People have moved from finding rentals in real estate agents’ high street offices and onto online platforms. New third-parties like apps and other digital platforms offer non-cash alternative bond products, schedule property inspections, collect rents, and organise repairs.

Even though these technological innovations avoid agents, they have in fact increased their share of private rental sector management. Agents themselves are use these platforms to change their businesses, and the structure of their industry.

Our research found that revenue from an agency’s property management business (its “rent roll”) has become increasingly important. Some players in the industry are consolidating their businesses around it, to make higher profits from tech-enabled efficiencies.

However, the real estate business still depends on building personal relationships, particularly in high-end markets.

The new tech platforms of the private rental sector raise issues for tenants too, particularly in terms of the personal information they collect. For example, one of the online platform operators told us they looked forward to using applicants’ information to score or rank applicants. Another one of the new alternative bond providers uses automatic “trust scoring” of personal information to price its product.

These innovations may be convenient to use, and may give some tenants an advantage in accessing housing - but at the expense of others who are already disadvantaged.

Rental properties meeting demand?


If the private rental sector is going to meet the demand for settled housing, governments will have to intervene. This can’t be left to technological innovation, or higher income renters exercising their consumer power.

Federal or state governments could create public registers of landlords, or licensing requirements, to police landlords who are not “fit and proper” and exclude them from the sector.

There could also be stronger laws around tenancy conditions and protections for tenants against retaliatory action. The Poverty Inquiry in the 1970s set the basic model of our present laws and they haven’t changed much.

Tenants’ personal information also needs to be protected, to properly take account of the rise of the online application platforms; another is the informal sector, which is currently in a regulatory blindspot.

The ConversationThe popular emphasis on “mum and dad” investors diminishes expectations of landlords. Rental property investment should be regarded as a business that requires skill and effort. As for-profit providers of housing services, landlords should be held to standards that ensure the right to a dignified home life.

Chris Martin, Research Fellow, City Housing, UNSW

Thursday, November 23, 2017

There goes the neighbourhood - Renters in the Census 2016

This week saw the publication of new research from the ANU showing that the problems of housing affordability in Australia don't stem from an undersupply of housing. This is something we've been saying for years - it is not the overall supply that matters, but the kind of supply. Specifically, supply of housing for lower income people.

A few days earlier, the Urban Displacement project in the US updated their San Francisco maps. That project is looking at where people with lower incomes are going when they become priced out of the area they are living in. That updated prompted the crew at #WeLiveHere2017 to ask if anyone was doing similar work here.
We thought this was definitely something worth looking into ourselves and we intend to devote a few posts to exploring this issue through crunching some Census data. This first post explores the very lowest income households. The following pictures are here for our mobile readers - they come from an interactive map available here where you can zoom in to any location in NSW and get more details.

We calculated the range of weekly household income for all households in NSW and found the first quintile, or lowest 20% of household incomes, in local areas (for the nerds, 2016 Statistical Area 2) across the state in both 2011 and in 2016.

Then we started looking at how many rental properties in local areas were reporting paying rents that would be affordable to that income level. This includes all forms of public and community housing, as well as private rentals. Using the 30% rule, in 2011 the lowest quintile could afford a property being rented at $155 per week. By 2016 this had risen to $198.30. The following two maps show the raw numbers of properties meeting that number across Sydney. About two thirds of these properties across the state are public or community housing.

Unlike all other rent price sources, such as bonds data and advertisements, the census exclusively measures sitting rents. This is significant in that it explains why some areas may have a higher number of these affordable premises than might be expected if you are used to looking at articles talking about rent movements.

Click the image for a larger picture or the interactive version here


Click the image for a larger picture or the interactive version here

The change is only slight when looking at these raw numbers, but the story becomes much more clear when we look at the change between the Censuses. Across Sydney the proportion of housing available for people on the lowest incomes is dropping - except in a few areas potentially indicating a concentration of this affordable housing.

Click the image for a larger picture or the interactive version here

However, we reckon there's a bit of a difference between an area with very few properties affordable to the lowest income quintile dropping and an area with quite a few affordable properties losing them (or gaining them). To explore that a bit more we've created a final map, which categorises the local areas into 12 groups depending on their placement on a scatter plot. This scatter plot measures on one axis the proportion of housing in the area which on Census night in 2011 was being rented at a rate that was affordable to households in the lowest income quintile and on the other the movement in the proportion of that affordable housing between 2011 and 2016 censuses.

The colour scheme divides those areas losing affordable housing into three equal sets and those areas gaining affordable housing into three equal sets. They are then further divided based on whether they have more or less than the median amount of affordable housing at the 2011 Census.


Once that scatter plot has been mapped we get the following map - zoomed in on Sydney here but the interactive version covers all of New South Wales.
Some of the areas that may seem surprising to appear in the affordable column are there because whilst they are generally affluent areas they do have concentration of public and community housing - or at least did. As one example the Hunters Hill - Woolwich statistical area comes up as affordable due to approximately 167 of the 683 total rental properties in the area being public or community housing - nearly 25%. This is a high proportion considering that across the state only a little over 15% of properties fall into this category.

Click the image for a larger picture or the interactive version here

So what do we learn?

In Sydney it is essentially a bad news story everywhere we turn - either there are unaffordable places getting worse or there are nominally affordable places getting worse. All that bright blue is areas with affordable housing disappearing. The orange is areas with unaffordable rentals that are disappearing. Across the state there appears to be a concentration of affordable housing occurring with most areas falling in the proportion of affordable housing but increases in pockets.

That these rents are sitting rents raises another concern - what happens when people are forced to move? Fortunately a high proportion of these properties are public or community housing but a significant number are in the private market. As such these are households who are in very vulnerable positions. If they do need to move, especially in the private rental sector, they are likely moving on to much higher rents as the market continues to rise.

This is an early version of this data - we haven't adjusted rents and income for household size for instance. It is clear that a single person on the same income as a household of five is more able to fit in a smaller dwelling more comfortably and likely in more affluent areas.

In the next version of these maps we'll be making these adjustments and drawing out the changes in public and community housing as well as looking at slightly higher income groups.


Friday, August 25, 2017

New Bonds data released but more is needed

Yesterday Fair Trading released bond data for the first time other than through the Rent and Sales Report. We welcome the release of this data as it will be very useful to enhance understanding of issues and trends in the rental sector. As the Minister for Innovation and Better Regulation, Matt Kean said in his media release, “I want to put consumers first and this data does that by allowing open, transparent access to useful rental information.” Sounds good to us, Minister!

However, it pays to understand what this data tells us - and just as importantly what it does not.

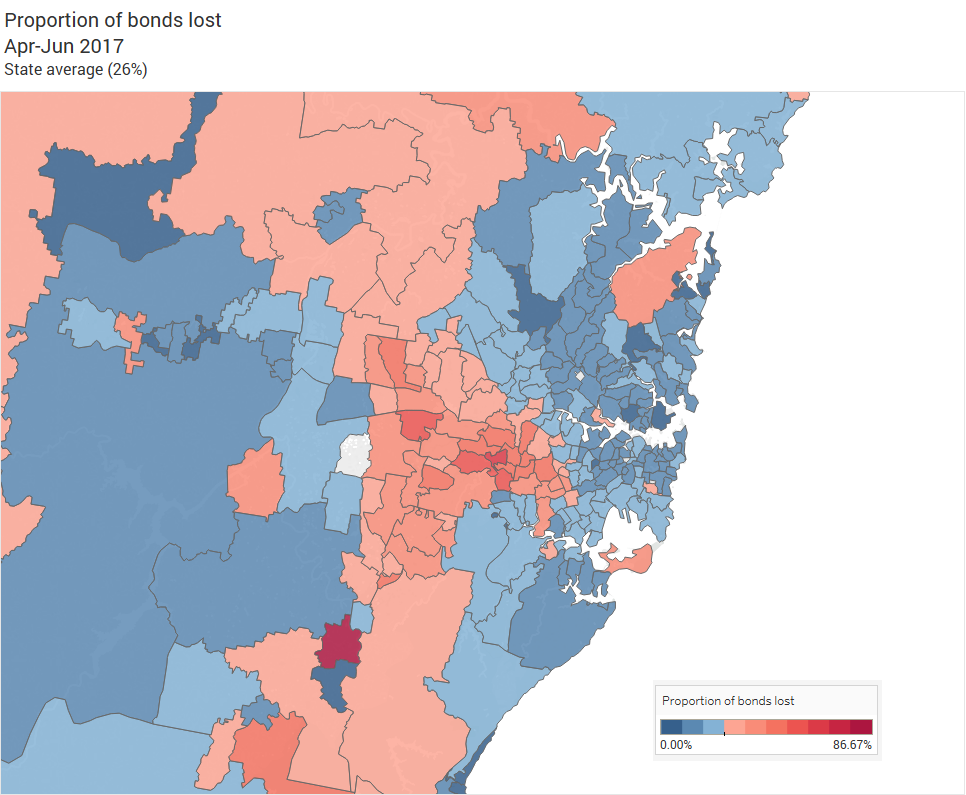
An article this morning helped to demonstrate the limits of this data. Looking over the data, the journalists discovered that a much larger proportion of bonds being refunded in some areas of Sydney and New South Wales were going to the landlord rather than the tenant. The problem is we don't know the context of those bond refunds, and how they were claimed.

Click for full size!

Bonds can be released from the Rental Bond Board in one of three ways. The landlord and tenant can come to a mutual agreement and lodge a bond refund form with both parties agreeing to amounts payable either way. If the parties can't come to an agreement, one or other of them  can make a unilateral claim for what they think is appropriate, without the other party's signature. The person who didn't sign is given 14 days to lodge an application to the Tribunal if they disagree with the claim. If they do not take it to the Tribunal the bond is paid out as requested. This is the second option. The last option is that the dispute does go to the Tribunal and the bond is decided either by a final negotiation, or as decided by the Tribunal Member.

Tenants and landlords should both be aware that the bond is the tenants' money. It is held in trust by the Rental Bond Board - it is not some common pool of money and landlords should not regard it as theirs for the taking. Vulnerable tenants may be unaware of their ability to dispute a claim against the bond, or indeed feel unable to assert their rights due to their vulnerability in the rental sector.

Whether bond refunds are agreed upon, or disputed, and whether a claim made by the landlord has been tested in the Tribunal is a crucial piece of information which the Rental Bond Board already has in its data banks and could release. It would go a long way to allowing researchers and journalists to peer behind the information that's already been released and examine the geographic differences that have been drawn out.

We've also heard that exit surveys on bonds have been considered - we think this is an excellent idea. For instance there is no information currently collected about how and why tenancies in NSW end - this means a government and community making decisions about how effectively tenancy legislation is working have a very deep and dark blind spot on an incredibly important aspect of renting law. An exit survey on the bond claim form would be a simple and effective way of adding a depth of knowledge to our collective understanding of the renting experience in our state.

In the spirit of open and transparent access to information, we encourage the Minister and Fair Trading NSW to consider releasing both the currently available information of whether bond claims are disputed and tested, and strongly consider implementing the bond survey to develop a truly excellent source of data.

Friday, July 21, 2017

Australia's 10 million spare bedrooms

This morning The Guardian published an article using recent data released from the Australian Institute of Health and Welfare. It was a good piece, but it had a somewhat misleading headline. The Brown Couch's founder had this to say:


If the vacancy rate in public housing is only 3% what was the headline trying to say? They were measuring the use of bedrooms in public housing and noting that one in six bedrooms is "under-utilised."

As it happens, this year the Census data introduced a specific measure of "Housing Suitability" which measures whether a household has spare bedrooms, or needs extra. Let's take a look at the state of bedroom use.

Not the typical use of a bed
The data shows about 75% of our spare bedrooms are in owner occupied housing. It isn't just that a majority of Australian homes are owner-occupied - 87% of homes owned outright have at least one spare bedroom, and almost 60% have two or more. Mortgaged homes are slightly better, as only 77% of these have a spare bedroom. 41% have two spare rooms or more.

Australia wide, the story is the same. There are more than 10 million spare bedrooms in Australia. Around two thirds of our mortgaged homes have spare rooms, as do 80% of homes that are owned outright.

Social housing looks very different. Not only do less than a third of tenanted social housing properties have a spare room, there are more in this tenure type that are mildly overcrowded. 2 in every 5 social housing dwellings are in need of at least one extra bedroom.


Renters both in the private rental market and social housing are much better at utilising their bedrooms than owner-occupiers. There are different reasons for this - where private renters are pushed to efficiency by price signals and competition (ie you generally only rent as many rooms as you need, unless you're either bonkers or rich), social housing renters are pushed by the allocation strategies of their landlords. Social housing tenants who do have a "spare" bedroom do so because they need it, and are entitled to it under the policies of their provider. For example, households may be given an additional room for a live-in carer, for family members who reside with them part-time, or for cultural reasons.

Of course, the other major reason we hear of social housing tenants ending up with a spare bedroom is that their allocation is not really suited to their needs, or their needs have changed since their allocation  made. You can't really blame a household for so-called "under utilising" if they're occupying the only property that is available to them - our failure to build enough social housing properties throughout the ages means many people have nowhere to downsize to as their needs change.

Despite this, social housing tenants are clearly putting their part of the nation's housing stock to the most efficient use, relative to the rest of the population.

Well done to you all!

Thursday, April 20, 2017

Where do our landlords live?

Last week's release of tax data from the Australian taxation Office has renewed discussions about who benefits from negative gearing and whether the perk could be better spent. However, the data also produced some insights about where our landlords live. That is, the post-codes of people who declare rental income to the tax office are now recorded. Now isn't that interesting?


We've previously discussed how tenure breakdown is becoming an increasingly important electoral factor, and why all politicians should support tenants' rights. The growing number of households who are long-term renters could begin to have an impact in elections for marginal seats. It's clear from the new tax data that landlords are concentrated in particular regions, and continue to outnumber tenants in a relatively large number of spots where a high rate of owner-occupation remains the norm. However, as the demographics of New South Wales change, this will also change, potentially bringing more and more votes into play as members of the community allow their votes to be influenced by housing policy and promises.

Particularly those for whom current tax settings and regulatory frameworks do not work and are in fact harmful - namely tenants - this data should be of interest. We've made three maps exploring this data with one question in mind: where do our landlords call home? Although it is important to note that this data only records where a person reports their income - the rental income may come from an entirely different state. They might actually be someone else's landlord.

The interactive maps here can be explored by click and dragging, and zooming in and out with the + or - buttons on the screen.

First, we looked at just the raw numbers of people who declared some rental income in the 2014-15 year. Baulkham Hills (postcode 2153) was the clear leader here - 7,709 taxpayers from that area declared some rental income. Two other Western Sydney areas featured highly in this count - postcode 2145, to the west of Parramatta and postcode 2170 located around Liverpool.

The picture starts to colour in a little when we look at landlords as a percentage of all people declaring income of any form. It's important to note that even though almost all adults or near adults pay tax (for instance, through GST) not all people lodge tax returns. Tax data should be treated with some caution on account of this, but it can give us a reasonably clear picture. On this map, blue signifies where more than the national average number of landlords per tax declarant reside, and green shows where there are less than the average. The North Shore's relatively high number of landlords comes through, but Sydney's south and south west also feature strongly. In fact the two areas with the highest proportions of landlords per tax declarant are Orchard Hills and Horsley Park in the south west.
This high proportion is partly due to the relatively low numbers of people in the areas, but it could also suggest some things about how housing investment works. These areas were developed not so long ago, and new homes may have been purchased by households who already had a foothold in the property market; or they may have been purchased by first homebuyers who have since tapped into rising house prices, borrowed up and bought some more... Getting to the bottom of that would make for an interesting research project.

Finally, we looked at the number of landlords in an area compared to the number of bonds lodged with the Rental Bond Board. This gives a clearer indication of areas where landlords live compared to where they invest. Green indicates less than a 1:1 ration of landlords to tenants, which is what you would expect since there are fewer landlords than then there are tenants. Blue indicates there are more landlords than tenants in an area - indicating that these are the areas where housing is not being brought into the private rental market. In Sydney, the postcodes 2156 (Annangrove) and 2125 (West Pennant Hills) are noticible as centres for landlords, joining Orchard Hills and Horsley Park. We haven't tried to account for "rentvestors" of course who will contribute to both counts.


However across New South Wales there are a number of areas which have very high numbers but can be explained by very low numbers of both tenants and landlords - for instance postcode 2898 (Lord Howe Island) has the highest ratio of landlords to tenants in the state - at least partly because there are only 3 bonds lodged. It is still interesting to see the locations where landlords outnumber tenants, sometimes by quite a margin - and of course, this doesn't account for landlords who are also tenants themselves.

Bonus: National versions of the first two maps are available.
The number of landlords in each Australia postcode
The percentage of landlords of tax declarants in each Australian postcode

Thursday, April 6, 2017

Airbnb and the rent in Sydney

Today we released our report into the impact of Airbnb on the rent in Sydney. You can check out the full report here: https://tenants.org.au/tu/airbnbsydney2017. Let's have a closer look at some of the findings.


One of the interesting numbers we've examined is the number of Airbnb listings that are actually active in any given month. While it's true that people keep creating more and more listings on Airbnb, that doesn't always tell us the really important number - how many are active, and therefore what impact these listings are having on the rental market.

We really can't explore some of these issues due to the lack of data around housing in Australia. We don't know which properties are rented homes or owner-occupied, and this makes it difficult to read a lot into the numbers.

We can be clear that simply being listed on Airbnb does not mean a property has been removed from the rental market and there are two clear examples we can imagine to illustrate the point. Imagine a 2 bedroom unit in Bondi. The occupant lists the place on Airbnb for the week between Christmas and New Year's while they go away and visit family. If the occupant was an owner-occupier then this property wasn't available for rent, and Airbnb hasn't changed anything about that. If the occupant was a renter, then this property has also have not been removed from the rental sector - it is still in it.

The Greater Sydney area 
Whether it is owned or rented, what is more relevant is how often a property is booked. This chart covering the whole of Sydney from August 2014-August 2016 illustrates that there actually is a large number of listings on Airbnb which don't even receive one booked night in any given month. This suggests a large number of people have listed their property in the lead up to summer, booked it perhaps for a few nights over summer, and have no intention of listing the place again.

We can clearly see the summer bump both in December 2014 and December 2015 - far more activity then, than for the rest of the year. What is interesting though, is that the numbers of listings with 8 or more nights booked in a single month (or roughly 100 nights in a year) is much more constant throughout the year. This effect is very clear in our three hotspots with really large summer bumps in beach-side Bondi and Manly, and a still sizable but reduced bump in inner city Darlinghurst.


All of this leads us to think that for the majority of users, Airbnb activity is sporadic. However more commercial operators of course act differently, and are looking to maximise their occupancy all year round, leading to a more consistent level of activity. Regulation of short term lets should look to effectively control commercial operators, and ensure that their activity in short term lets does not produce harmful effects on residential tenants.

For the full report, including interactive maps - check out tenants.org.au/tu/AirbnbSydney2017